Visuals have always been an effective and fun way for me to learn, especially when the topic is abstract. The tkinker, turtle, and Pillow Python GUI libraries allow for simple image manipulation, down to the pixel level.
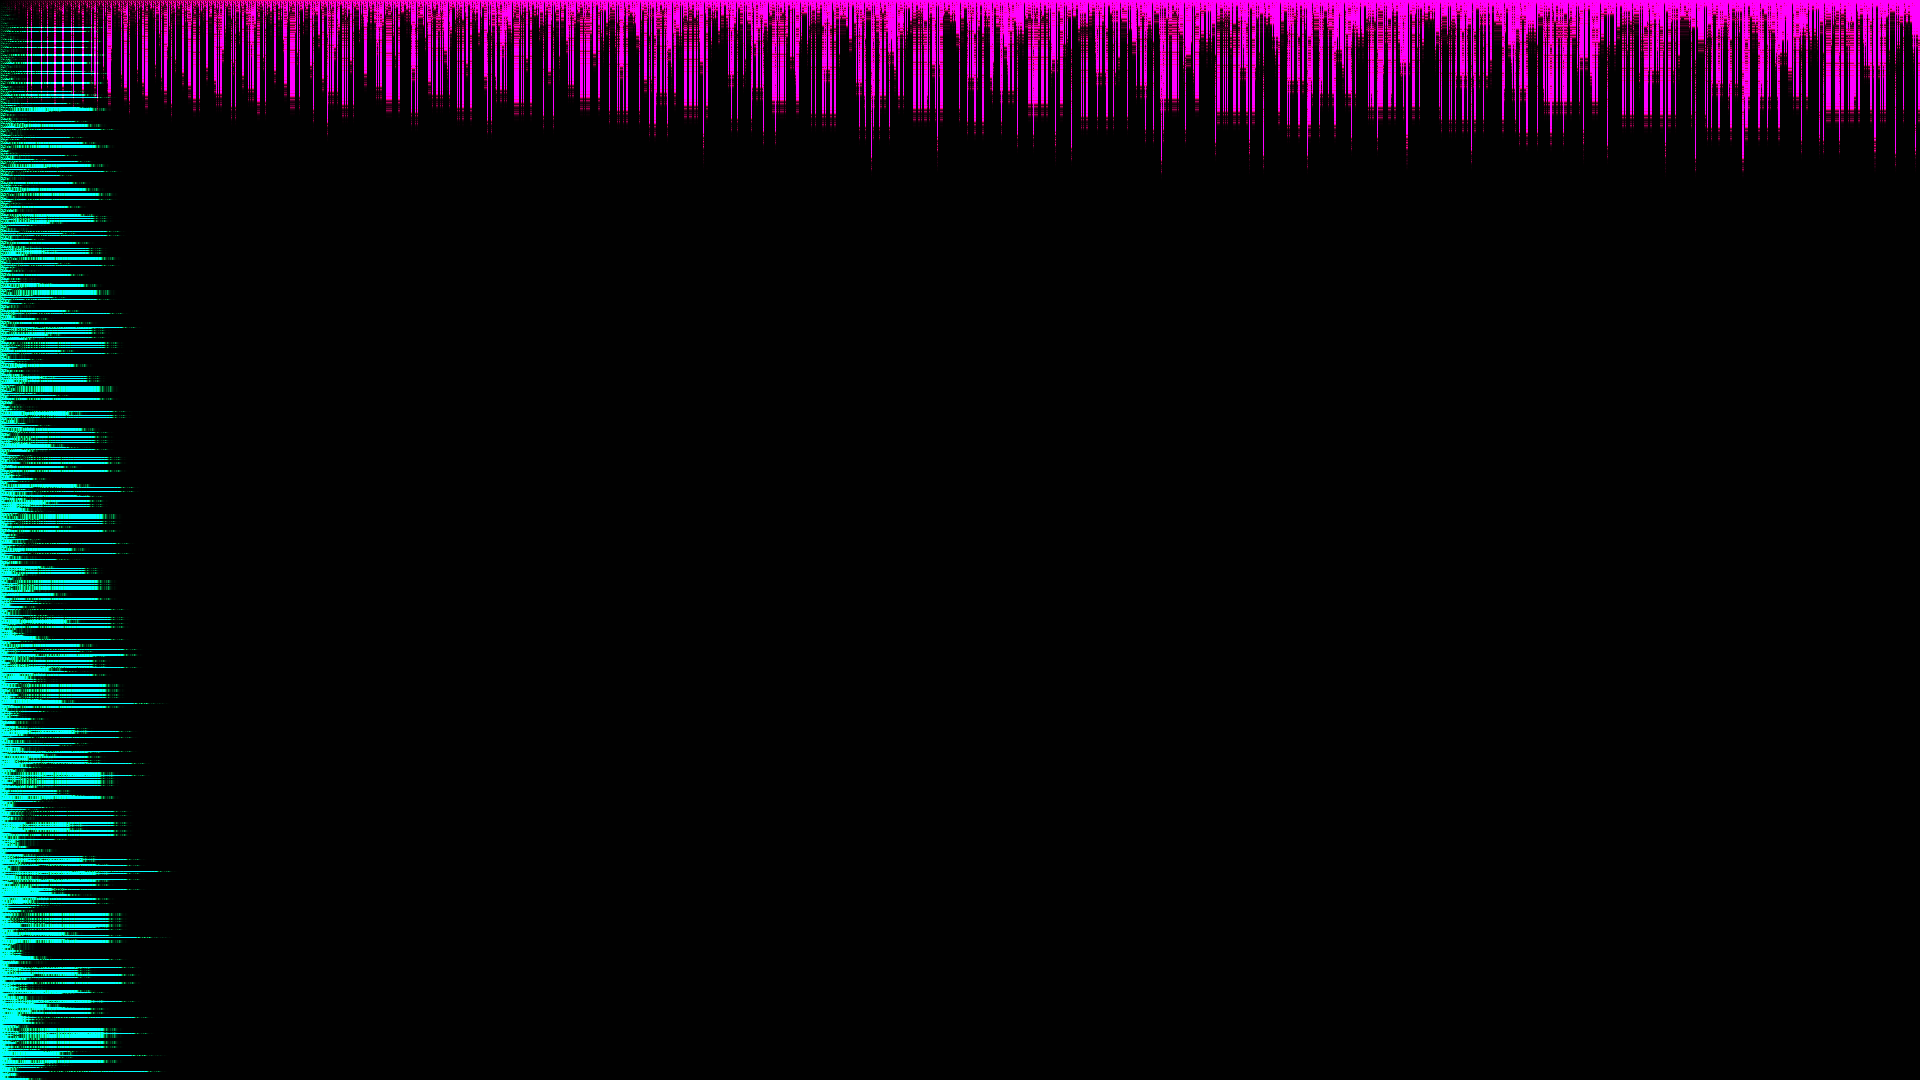
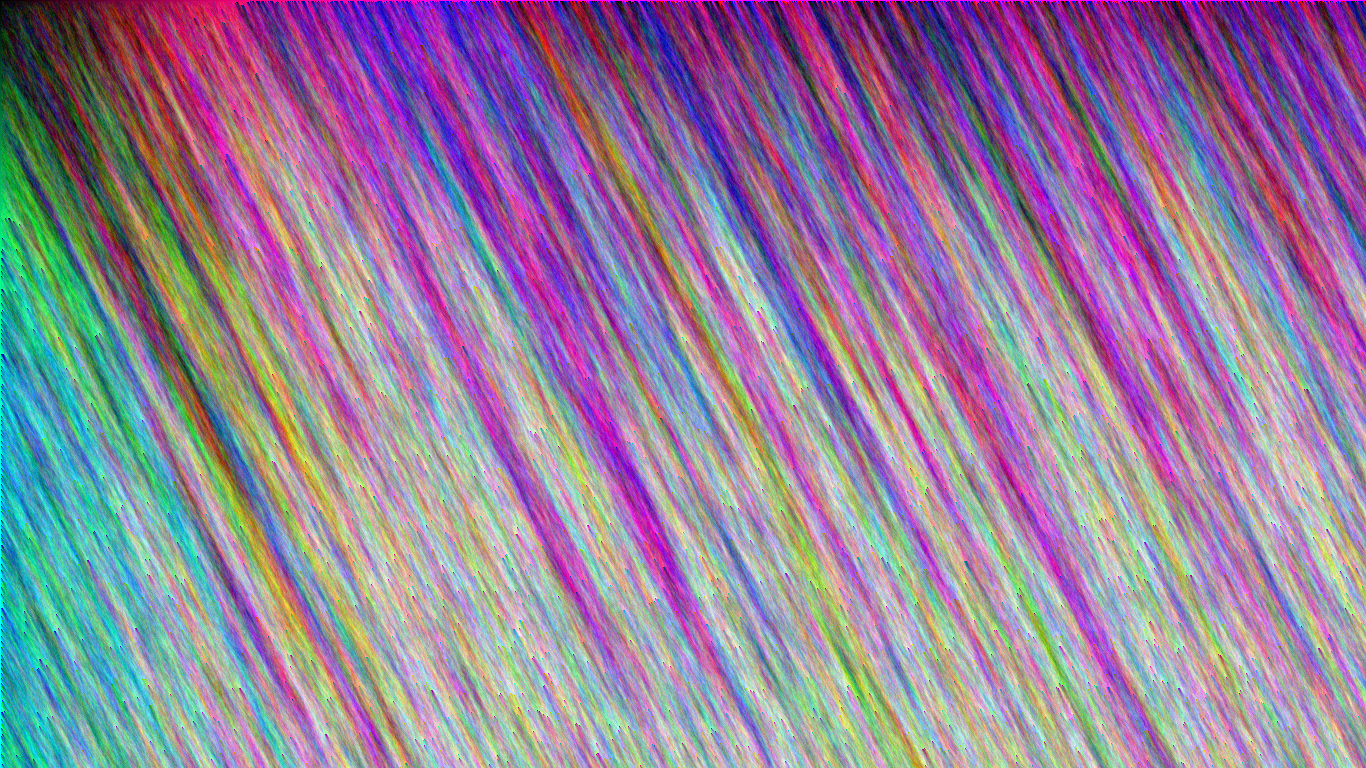
For example, the mostly black image below visualizes how numbers change after a given number of iterations in the unsolved Collatz conjecture; I like the chaotic look and contrasting colors so much that it has been my phone background for several years. Next is more artistic visualization, which applies a smeared watercolor effect to the same Collatz conjecture.
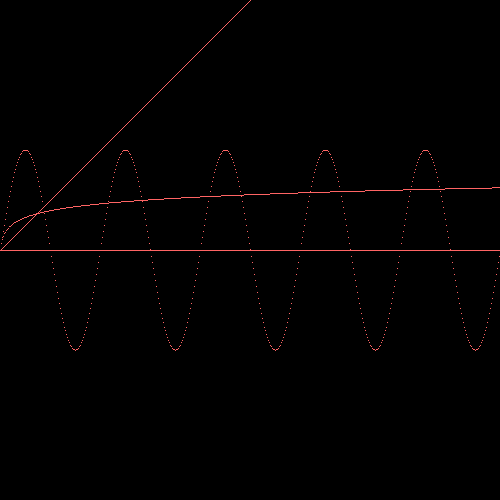
One can also visualize more useful and common mathematical ideas. The first image below shows how horizontal and vertical lines in the complex plane are transformed under e^(1/z). You can see concentric cardioids. The next image below shows the graph of several common functions, like sine and the natural logarithm.
.bmp)
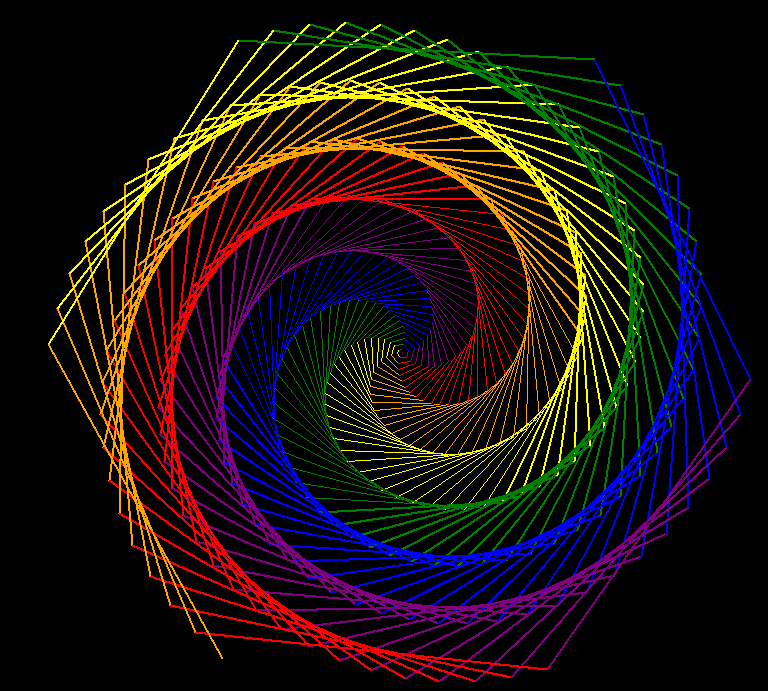
The Turtle library allows one to trace out colored paths in an image, like the rainbow spiral below. Getting a little more advanced, one can create recursive shapes, like the Koch Snowflake, Seirpinski Triangle, and dragon curve, shown below.
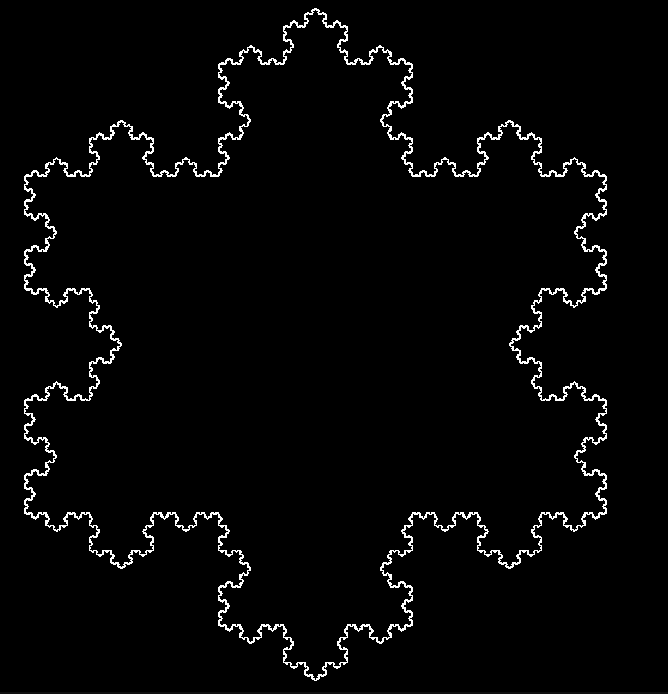
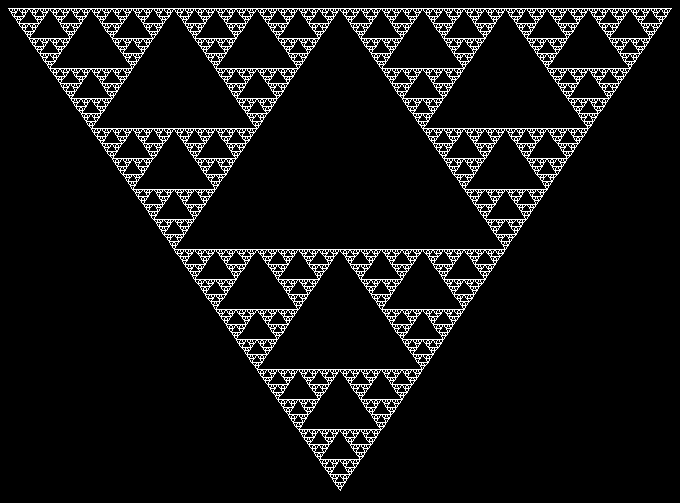
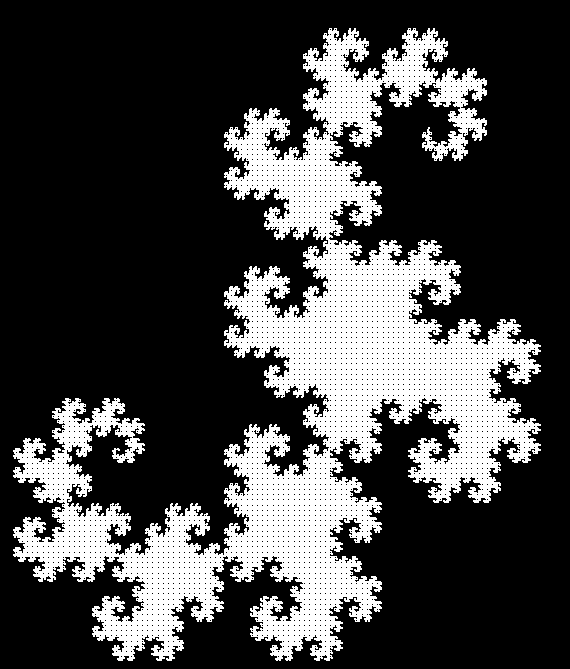
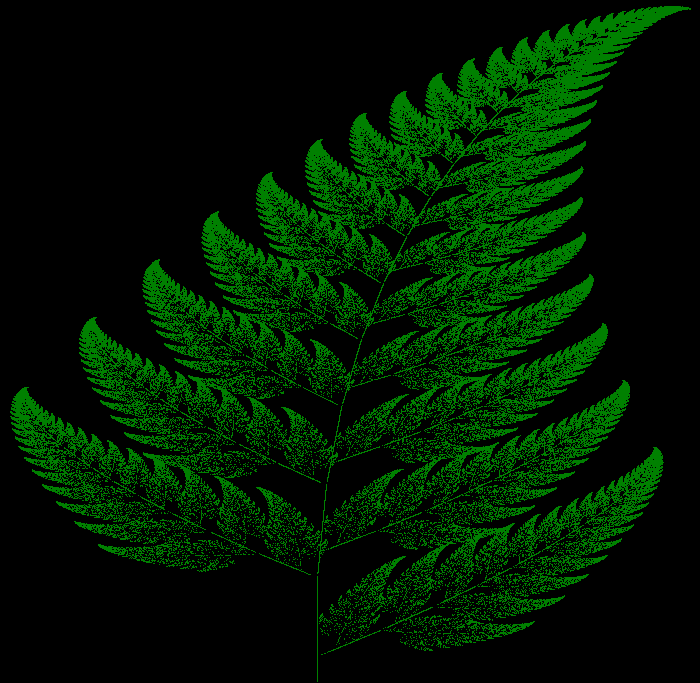
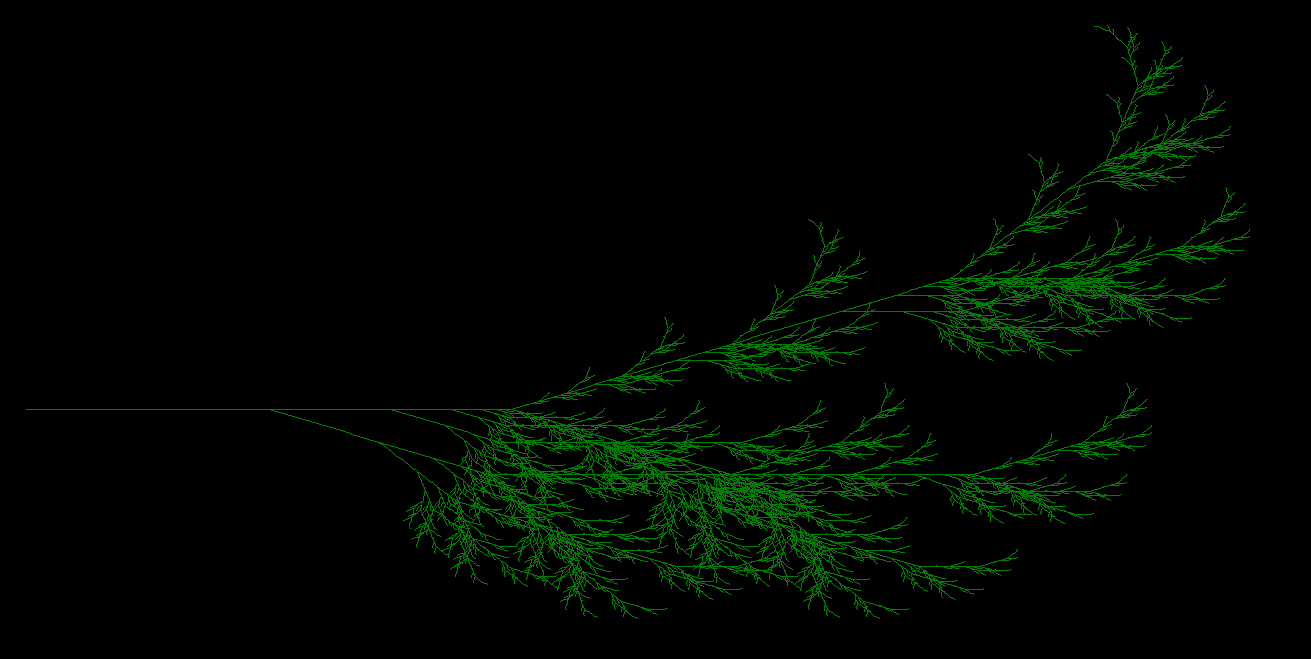
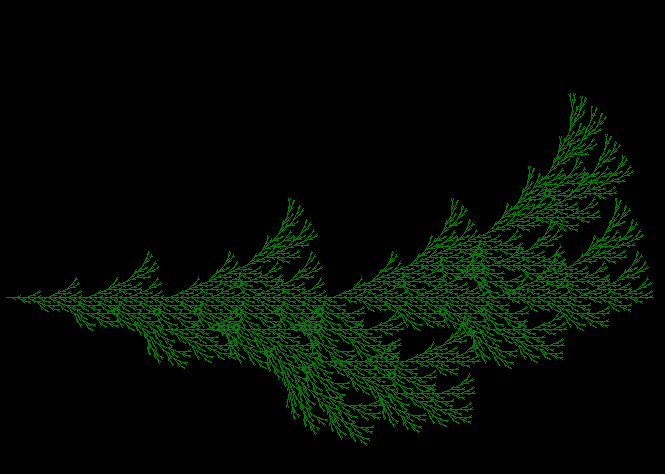
One can also make other startlingly complex images from a simple set of recursive rules. The below images, known collectively as "strange attractors," show a tree, Barnsley Fern, pine branch and piece of tall grass. The procedural generation techniques used to create these images, known as L-systems, which can in many of today's popular video games to make random, realistic terrain and plants.
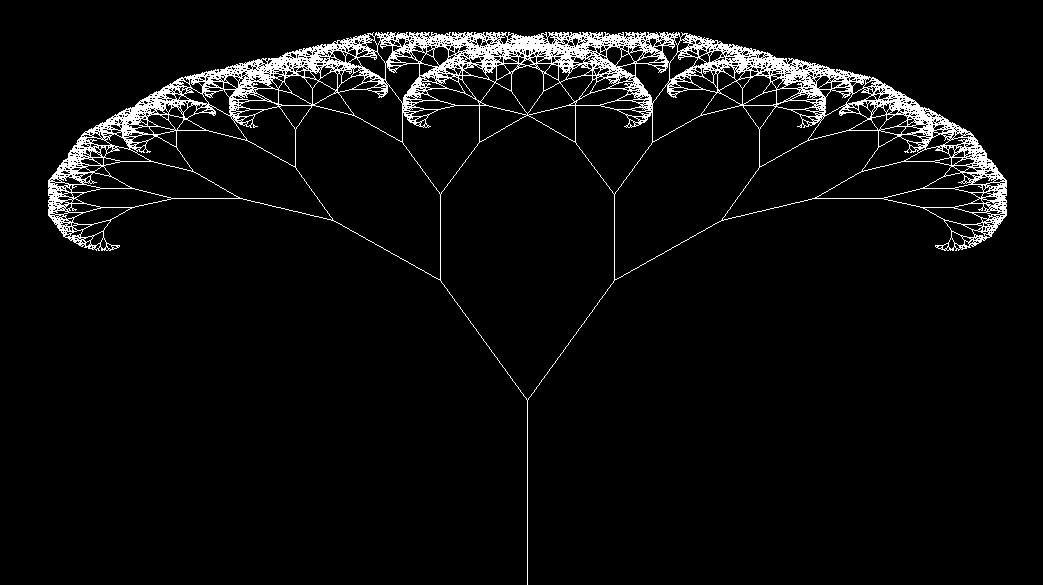
The images above and many others that I made in Python, as well as the code used to create them, are available on GitHub.