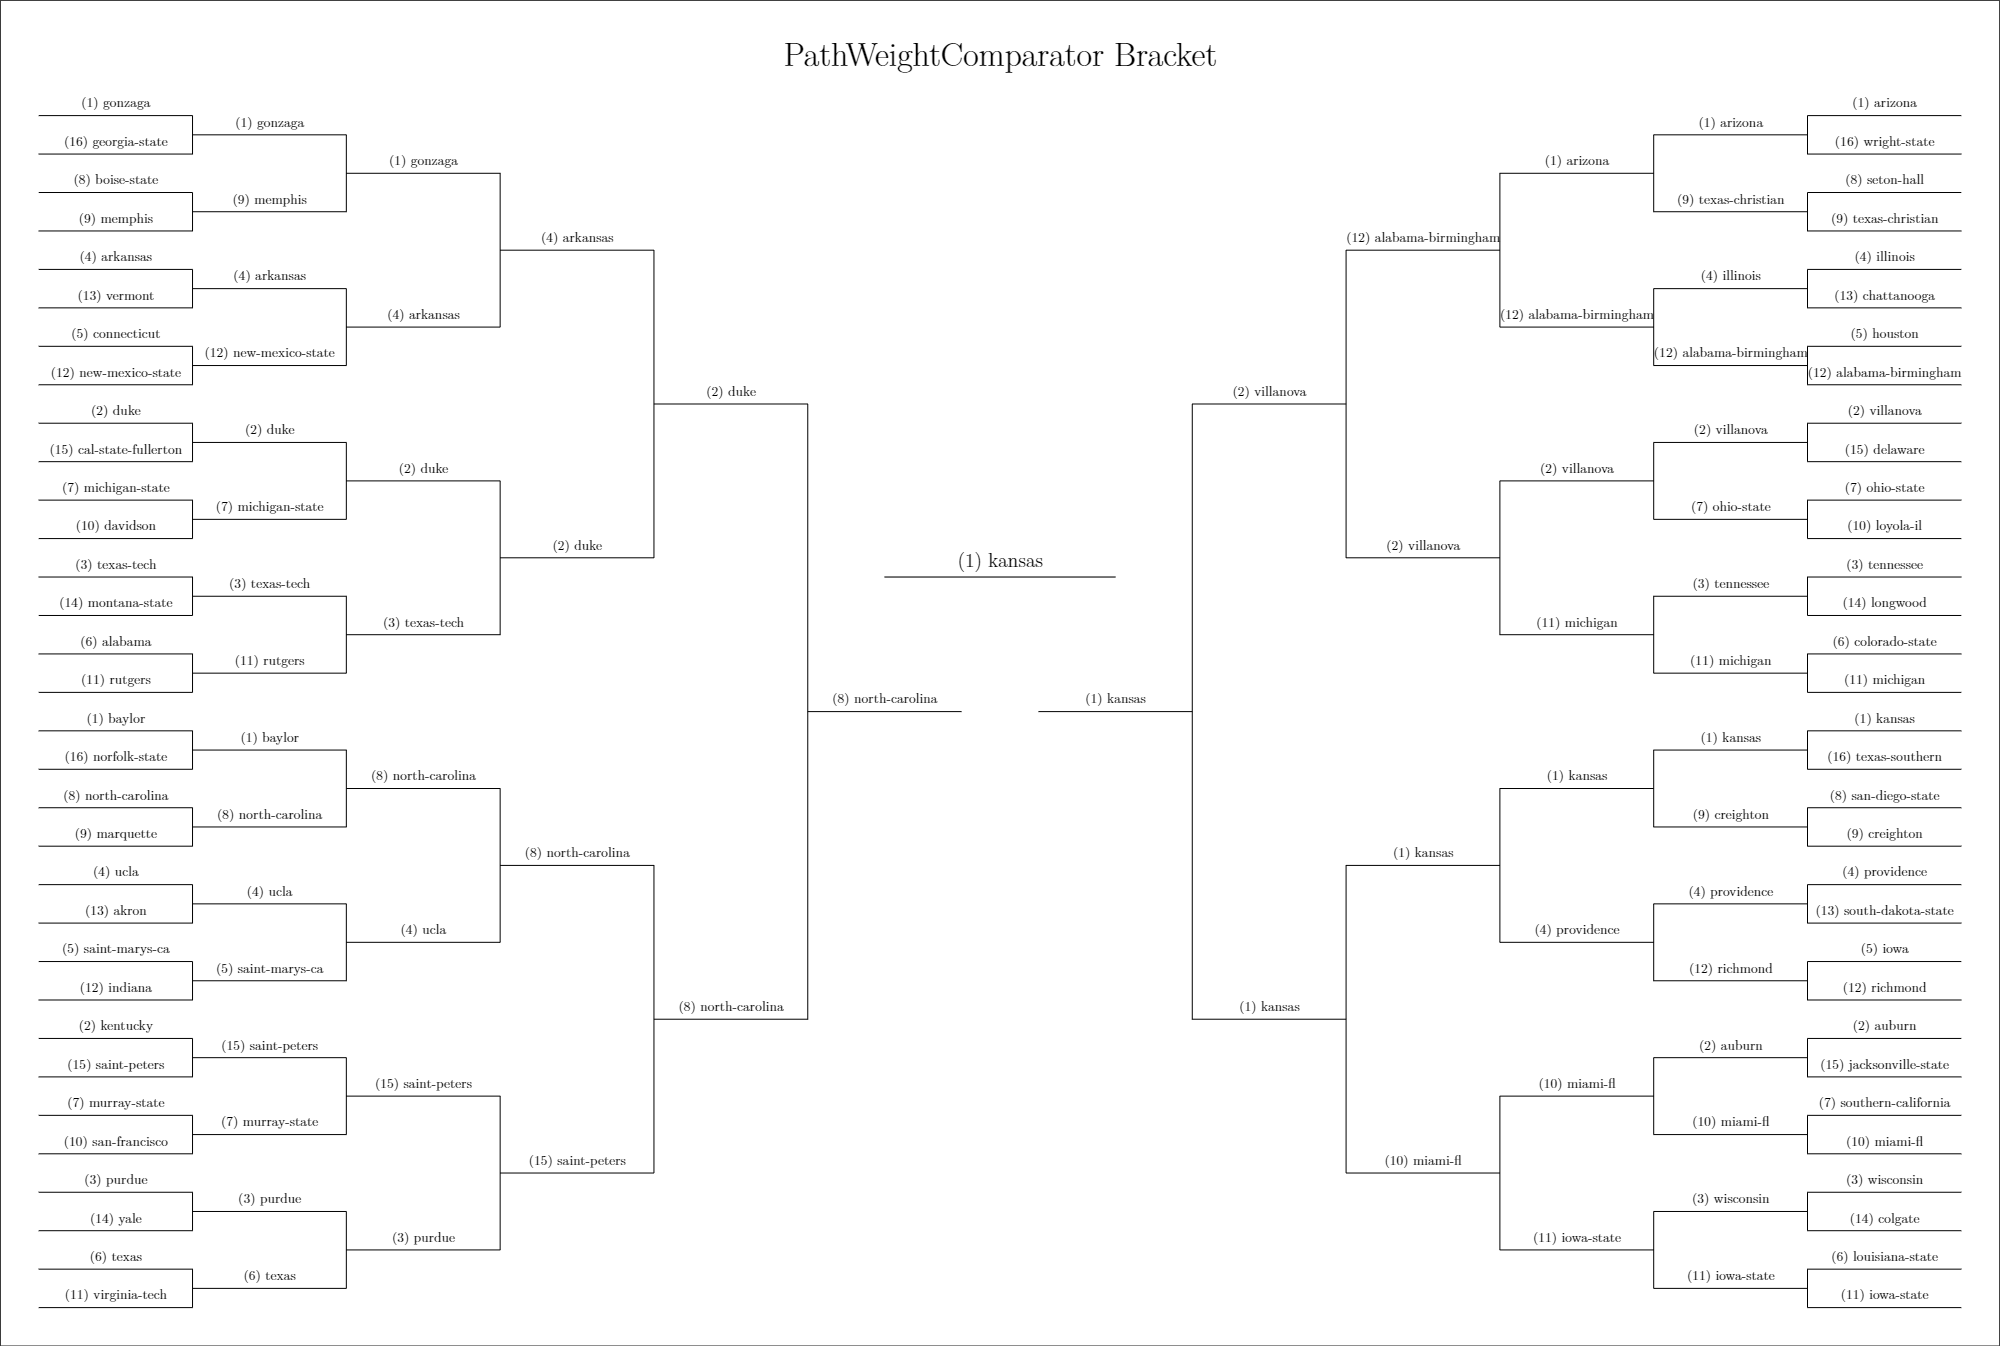
My friends and I really enjoy the NCAA Tournament. Even if our favorite teams are not participating, we've found that filling out a bracket is a good way to get excited about a game between two teams you might not have even otherwise heard of. We also compete against each other to see who can make the best predictions. Since I'm a computer scientist and someone who doesn't have the time to follow all Division I teams in the months ing up to March, I've created a Python program that automatically scrapes the web for game data, make predictions with a choice of several ranking algorithms, and generate a filled-in PDF bracket for me.

Web Scraping
The first step of the prediction program was to obtain game data from all teams that could participate in the NCAA Tournament. Although a much smaller number of teams have paritipated in the Tournament in the last decade or so, there are in theory about 350 Division I men's teams that could be included. Given that each of these teams plays about 20-25 games, I needed a way to scrape the roughly 3500 games that happen each year between Division I teams. Thankfully, SportsReference.com has these game logs, with a page for every school that's easily scrapeable by a Python tool like BeautifulSoup. To not send too many request to SportsReference, I save the results a CSV files and only re-scrape when needed.
Predictions
We now have a bunch of outcomes of regular season games. However, we have some problems to face. To start, many of the games we want to predict never happened during the regular season, so we need a way to infer the outcome of these games from our data. The simpliest and probably most pratical way to do this is to create a ranking of all teams and predict that every team will win against all lower-ranked opponents and lose to all higher-ranked ones. So, how do we create this ranking from the partial information we have? Mathematicians give us several options.
Elo
In an Elo rating system, all new teams are given a starting number of points. As games happen, winners take a certain number of points from losers. Thus, we'd expect better teams to have more points. The number of points exchanged is determined by the initial point difference between the opponents. Since its unsuprising that a team with a high number of points beats a team with a low number of points, fewer points are exchanged than if an "upset" occurs. This scheme has some statistical advantages. If the skill of teams is normally-distributed, then we can use the difference in points between two opponents to estimate the likelihood of the outcomes of a game between any two teams. This is desirable for our tournament predictions, since we can say if our prediction model is confident. Elo rating and variants are used to in real life to rate chess players and facilitate skill-based matchmaking in online games.
Bradley-Terry
In Bradley-Terry Ranking, we wish to assign each team a positive score and estimate that the probability that team X (with score y) beats team Y (with score y) as x/(x+y). We can calculate each teams score by starting with each team's score equal and performing many rounds of an iterated procedure that updates our estimates. The score estimates will converge to values that maximize the likelihood of our observed data. In real life, this method is often used in social sciences to determine a group's ranking of preferences for different options without needing to ask every group member their preference for every pair of options.
PageRank
In PageRank, we have a graph structure with nodes that are connected together by weighted directed edges. In a graph with N total nodes, we say the rank of a node X is the probability that if a person starts at a random node R and either jumps to a new random node with probability 1/N, or travels to a new node via edges from R with probabilities proportional to the edge weights that the person eventually reaches N. In our case, nodes represent teams, and the edges represent games. We can set the weight of each edge to represent the importance of the game, like the margin of victory for example. There is an iterated procedure that starts with all teams having the same rank and converges to the probability-based definition above. In real life, PageRank was used by Google co-founder Larry Page (for whom PageRank is named) to rank search results at Google.
Problems with Absolute Ranking
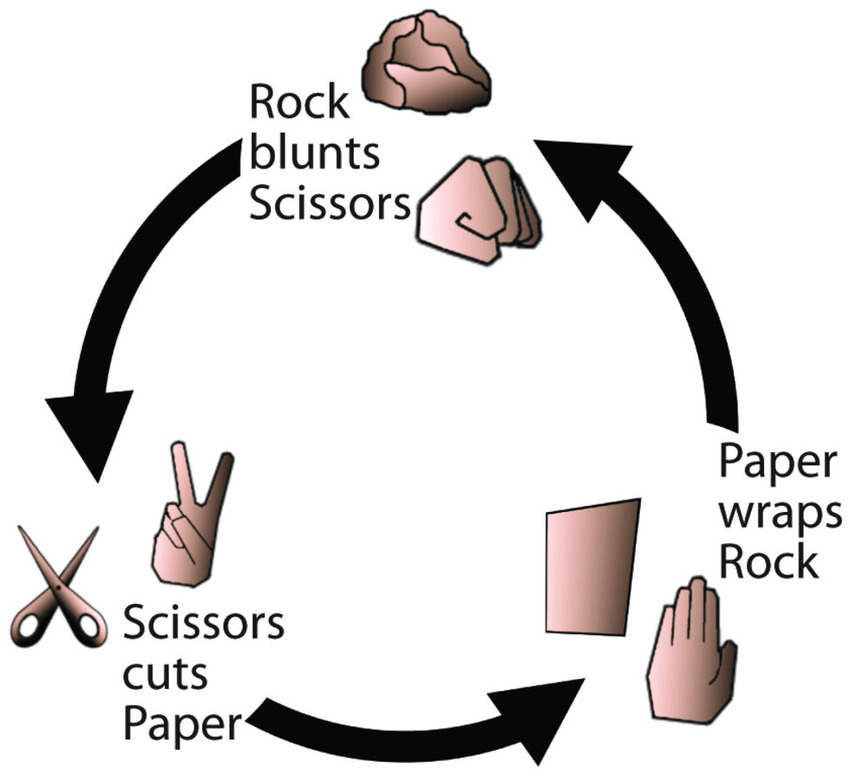
Although all the algorithms above are clever and find cool real-world applications, the fact that they generate an absolute ranking of teams means they all share the same flaw in modeling real games: transitivity. That is, if these algorithms predict that A should beat B and B should beat C, then they must also predict that A should beat C. However, there are plenty of examples of games where this is not true. Rock, Paper, Scissors is the most familiar example of a non-transitive game. If we gave the outcomes of many games of Rock, Paper, Scissors to any of the aforementioned ranking algorithms, the best they could do is say that rock, paper, and scissors are equally likely to beat each other, when we know this is false.
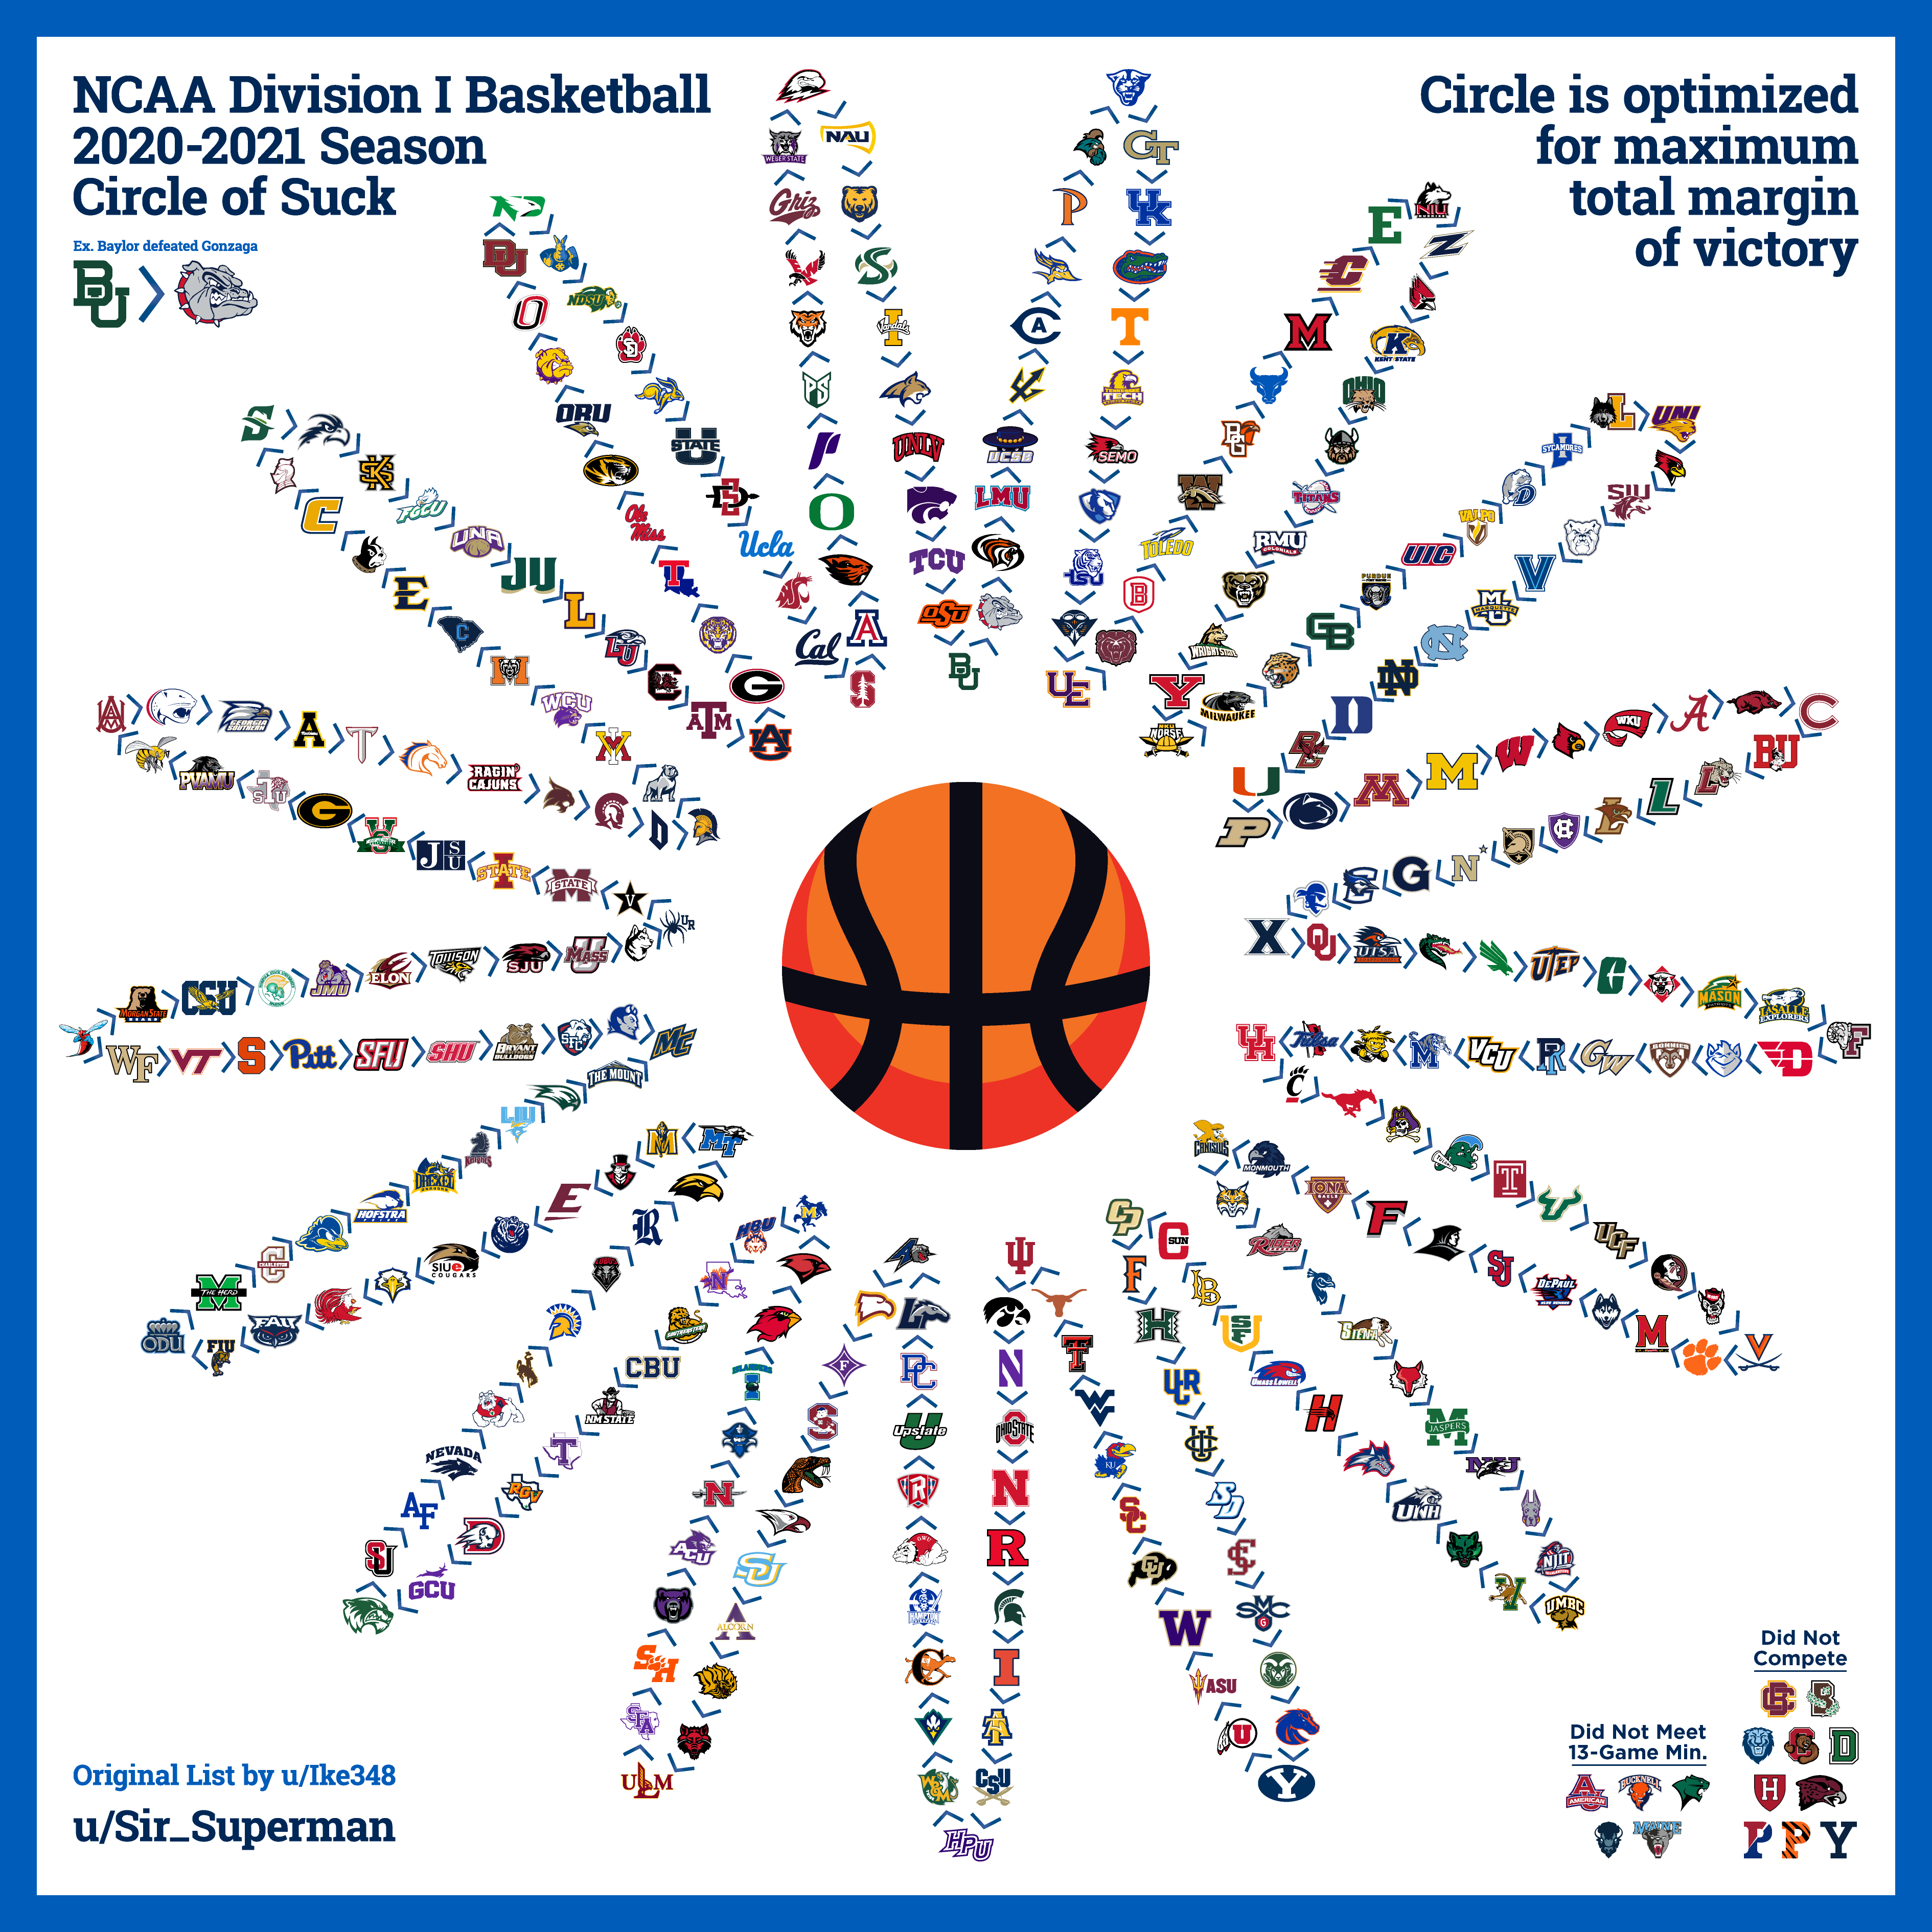
We can see the problem transitivity poses to accurate ranking visually. If we draw out the outcomes of some games between rock, paper, and scissors with arrows, we get a circle. These circles also exist in basketball games and can be big enough to include all Division I games, in what's known as a "Circle of Suck".


PathRank
Our tournament prediction algorithm only needs to do one thing: Predict the outcome of a game between two teams. This goal is not incompatible with Circles of Suck. After all, one can accurately say who will win any game of rock paper scissors. However, our approach of generating a list ranking of all teams is the issue. So, I have created my own algorithm called PathRank that can handle Circles of Suck. The setup is similar to PageRank where teams are represented by nodes and games between teams as weighted edges, the difference is we want more important games (e.g. those with larger margins of vistory) to have smaller edge weights. One then compares teams A and B by finding the shortest weighted path from A to B and B to A. The team at the origin of the shorter of these two paths is favored to win. The idea behind this approach is that the more "hops" you have to do between teans to infer one teams beats another, the less likely transitivity is to hold.
Although my algorithm does have the unique advantage amoung the ones I've mentioned to handle non-transitivity, it does have some problems. Most notably, all of the other ranking algorithms I've described have been studied my mathematians and statistians to confirm that they work. They also also stood the test of time in having been applied by many people in many different applications. Meanwhile, my algorithm thought up on a whiteboard in my bedroom, is not proven to work as indended, and only has been used by me.
PDF Generation
Now that I had a way to predict the outcome of games, I wanted a way to visually show my predictions. A filled-in bracket seemed like the best option, since it is what people are most familiar with for the NCAA Tournament. It was realtively straightforward to write a Python script that would write and compile a LaTeX file into a PDF. My only complaint is that my seed order (1-16, 8-9, 4-13, 5-12, 2-15, 7-10, 3-14, 6-11) is slightly different from what you'd see on a normal bracket (1-16, 8-9, 5-12, 4-13, 6-11, 3-14, 7-10, 2-15). However, both orderings result in the same matchups, so the difference is only aesthetic. Personally, I think my ordering is better because it can naturally be extended to create tournaments for any 2n participants.
Conclusion
All my code is availiable on GitHub, where you can generate your own brackets, investigate how the ranking algorithms work, and even extend the project to write your own ranking algorithm.